

| Version 4 (modified by , 15 years ago) ( diff ) |
|---|
Revision parameter missing. Current base revision is 55
Andere talen:
- Ελληνικά
- English
- Esperanto
- español
- føroyskt
- français
- 日本語
- norsk bokmål
- Nederlands
- русский
- українська
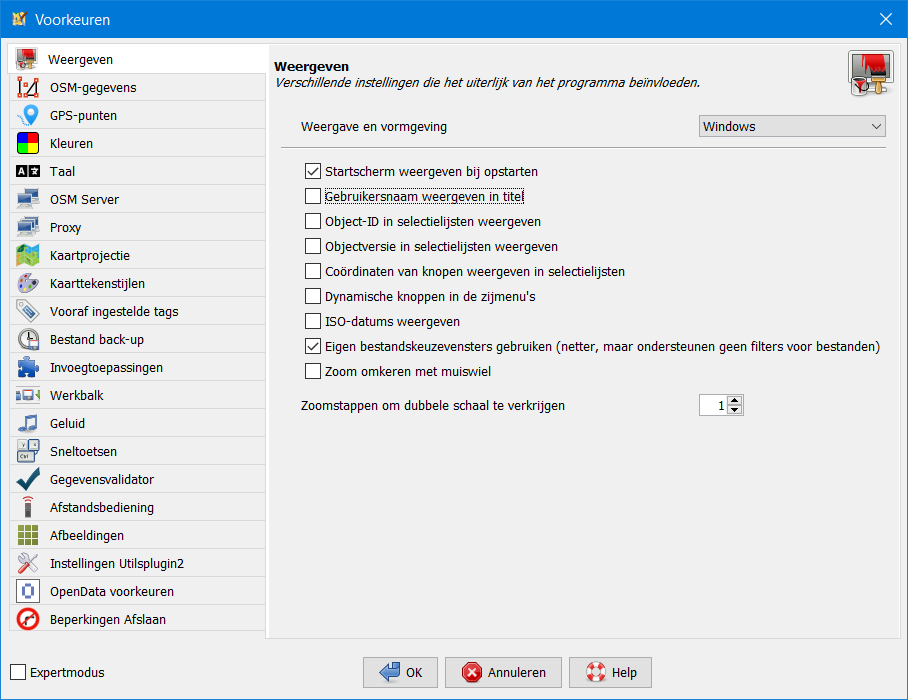
Voorkeuren > Beeldscherminstellingen

Verschillende instellingen die de visuele representatie van het gehele programma beïnvloeden. Beeldscherminstellingen zijn gegroepeerd in diverse tabs 'GPS=punten', 'OSM-gegevens', 'Kleuren', 'Weergave en vormgeving'.

GPS-punten
Instellingen die te maken hebben met de weergave van GPS-punten. Deze instellingen beheren de weergave van trackpunten als u JOSM gebruikt met GPS-traces die worden geladen vanuit een lokaal bestand, of de trackpunten van anderen die zijn gedownload van de server van OpenStreetMap.
U kunt maken dat lijnen worden getrokken tussen ruwe GPS-punten.
De grootte waarin GPS-punten worden weergegeven kan worden gewijzigd van standaard naar groot.
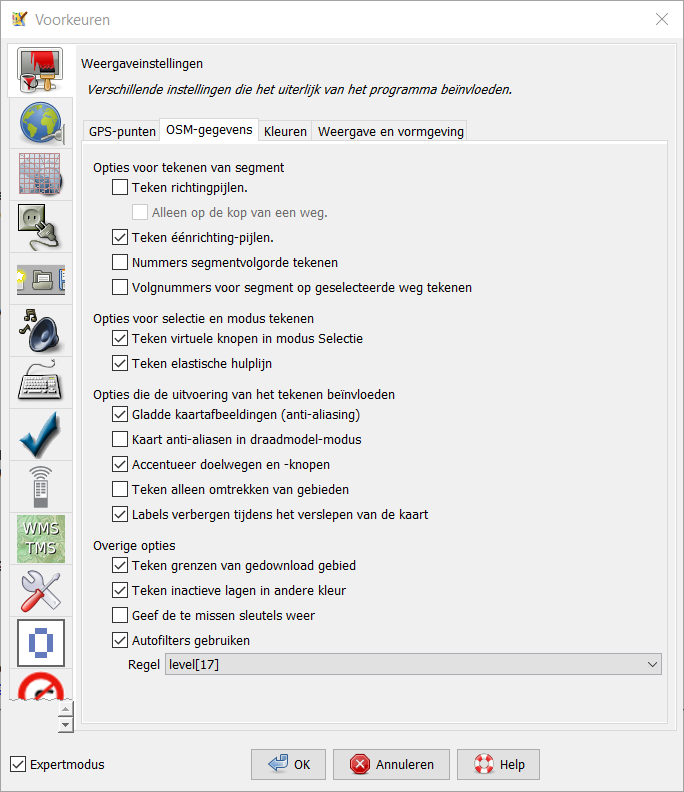
OSM-gegevens
Settings to do with map data layers shown in JOSM (ways/nodes etc)
You can cause an arrow to be drawn at the end of each segment, to show the direction in which the segment was drawn. You can also choose to have that arrow drawn only at the end of the way instead. Also, for some ways that have direction dependent tags (like oneway) oneway arrows can be shown.
You can choose to show the boundary of downloaded data. When downloading an area you get all the data within the rectangular bounding box you choose, and also, where any way within that bounding box extends outside the box it is completely downloaded. It therefore becomes difficult to precisely know which areas you have downloaded full data for. If you check the "Draw boundaries of downloaded data" box, yellow hatching is drawn over all the areas for which data has not been downloaded. You should avoid adding or editing data in areas of yellow hatching as it may duplicate already existing data.
You can choose to display inactive layers in a different colour.
In addition to these, the option to switch from "wireframe" to "paint" view can be found on the 'View' menu
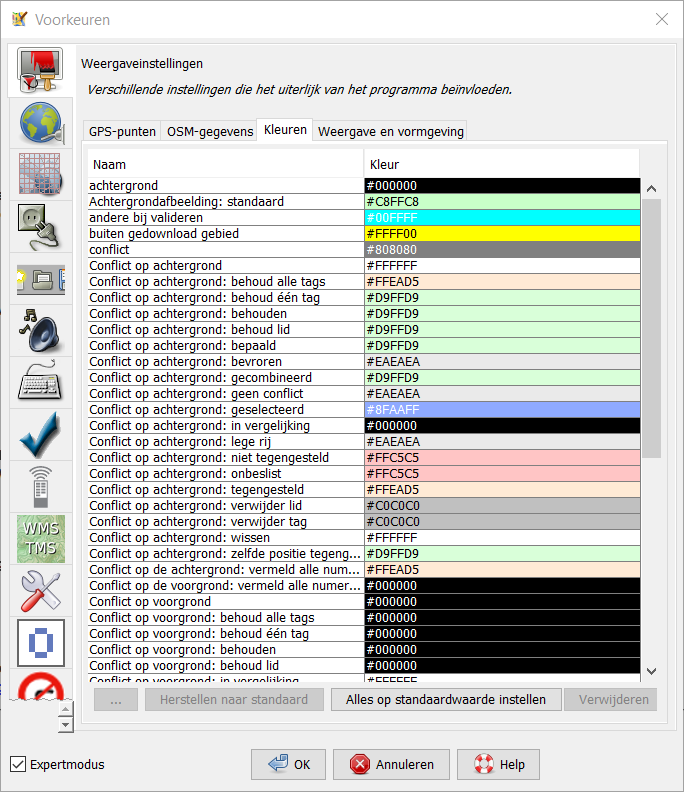
Colours
Colour choices. These largely relate to display of OSM data layers too. You can change the colour scheme for the display of nodes, ways, background, etc. "Paint style" options all relate to the non-wireframe view ('View' menu option)
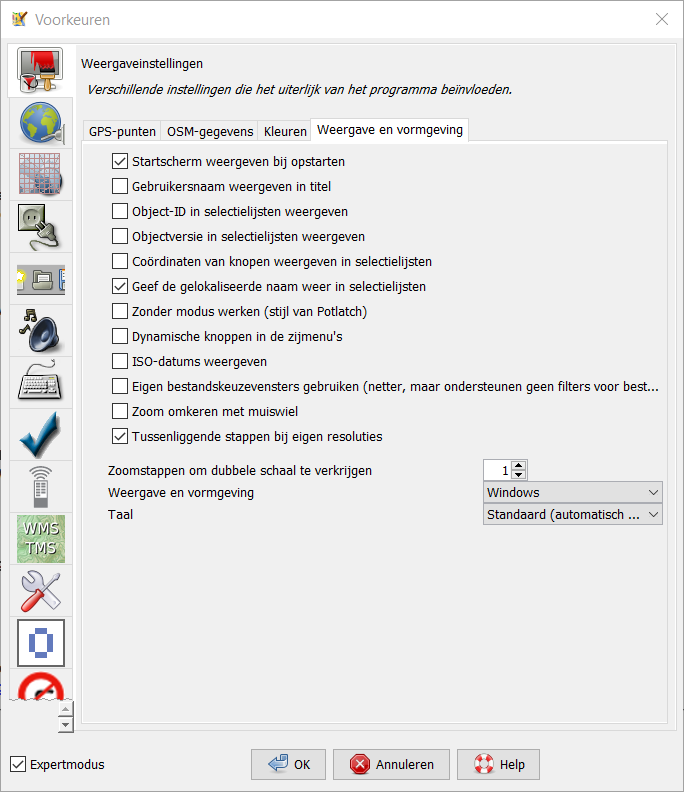
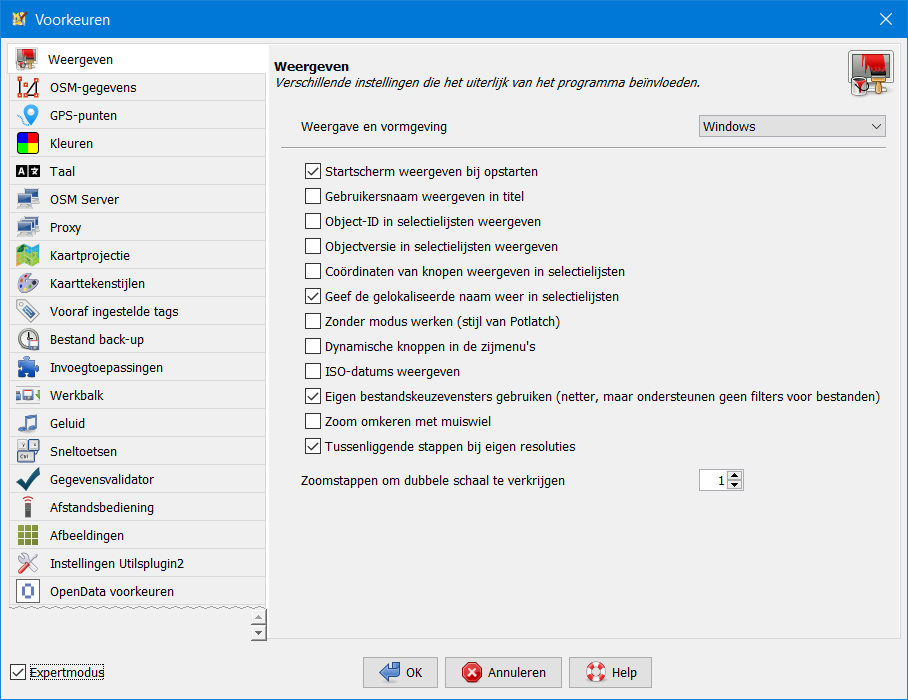
Look and Feel
Some overall look and feel options
Change the language of the JOSM interface here.
You can choose the overall theme, current options are : Metal, CDE / Motif, Windows, Windows Classic.
The [Modeless Working] option modifies the click behaviour when editing. It transits between modes in a more automatic way, similar to the online flash editor Potlatch.
Terug naar Voorkeuren
Terug naar Help
Attachments (9)
-
lookandfeel_theme.png
(4.8 KB
) - added by 15 years ago.
added image lookandfeel_theme.png (Dutch)
-
display_tabs.png
(8.4 KB
) - added by 14 years ago.
adjusted translation menu item
-
colors_nl.png
(91.1 KB
) - added by 6 years ago.
Renewed screenshot Dutch
-
gps-points-no-expert_nl.png
(70.0 KB
) - added by 6 years ago.
Renewed screenshot Dutch
-
gps-points_nl.png
(80.9 KB
) - added by 6 years ago.
Renewed screenshot Dutch
-
look-and-feel_nl.png
(72.8 KB
) - added by 6 years ago.
Renewed screenshot Dutch
-
osm-data_nl.png
(74.8 KB
) - added by 6 years ago.
Renewed screenshot Dutch
-
PreferencesDisplay_nl.png
(55.3 KB
) - added by 5 years ago.
new Dutch screenshot
-
PreferencesDisplayExpert_nl.png
(56.9 KB
) - added by 5 years ago.
new Dutch screenshot
Download all attachments as: .zip