


Opened 14 years ago
Closed 7 days ago
#8464 closed enhancement (fixed)
[patch] Grid Layer for JOSM
| Reported by: | Ghanian | Owned by: | wangi |
|---|---|---|---|
| Priority: | normal | Milestone: | 26.09 |
| Component: | Core | Version: | |
| Keywords: | grid layer | Cc: | jidanni |
Description
Hello,
i miss i feature. I would like to add layer which draws me a grid. (like the lat./long. grid, but i would scale it by myselfe)
I want to use it to get a overview over big areas. I want to see on a fast and easy way, which district is done by my work and wich district i have to do.
Hallo,
ich vermisse die Möglichkeit eine Art Layer zu aktivieren, welches mir eine Art Raster über die Karte, in der Art von Längen- und Breitengrade über die Karte legt.
Ich finde das nützlich, um bei größeren Gebieten auf einfache Art einen Überblick zu bekommen, was schon alles von mir bearbeitet wurde und was noch nicht. Also das wäre eher so eine Art Hilfsraster, wenn man das noch individuell skalieren könnte wärs toll.
Laut IRC sollen das angeblich schon ein paar andere Leute auch angefragt haben.
Attachments (6)
Change History (32)
comment:1 by , 14 years ago
| Type: | defect → enhancement |
|---|
comment:2 by , 14 years ago
comment:3 by , 13 years ago
Although there areworkarounds, IMHO it would be really nice to have this integrated in JOSM. I guess it wouldn't be to hard to implement it, or am I missing some difficulties?
comment:5 by , 9 years ago
| Cc: | added |
|---|
comment:6 by , 9 years ago
Such a feature would be really helpful for drawing classical parks and buildings, and grid cities. Since these are designed following a strict grid.
Requirements for the grid would be:
- Snap points on the intersection of grid lines, so that we can draw features exactly following the grid.
- Rotation of the grid (should not be locked to longitude/latitude).
- Grid lines at standard intervals (for example 1m, or 1 foot), and at custom drawn points.
- A possibility for other people to retrieve the same grid settings. (Maybe stored in metadata of objects that follow the grid?)
- Not limited to orthogonal grids, some designs use slanted grids, or grids with more than 2 axes.
follow-up: 11 comment:10 by , 5 years ago
you get a grid in josm with this workaround
- install the plugin/extension called "gridify"
- add a new layer
- in this layer add 4 points for the grid corners
- select the 4 points
- "More Tools" > Gridify
- choose your grid attibutes
- have fun with your mapping work
comment:11 by , 5 years ago
Replying to africanway:
you get a grid in josm with this workaround
- install the plugin/extension called "gridify"
- add a new layer
- in this layer add 4 points for the grid corners
- select the 4 points
- "More Tools" > Gridify
- choose your grid attibutes
- have fun with your mapping work
That's great! I didn't know this extension ...
It's not the same as a simple or smart grid (which could for example have a scale, could be rotatable and be configurable or could have a magnetic snap function as known from other drawing programs), but it's better than nothing and of course has other advantages. It remains strange to me that JOSM doesn't have a grid or at least rulers (more than the small scale at the zooming slider), because often you need a simple and quick guide for lengths and distances of objects. It's such a basis thing ... I know there's the status bar below with distance/length information, but that's not a full replacement ...
But I try to have fun! :-)
comment:13 by , 4 weeks ago
I think a lat/lon grid or a metric grid can be very helpful, but I can't find any...
comment:14 by , 4 weeks ago
As far as I know, there hasn't been any improvement in the last 14 years. It's regrettable that nothing is being done. It's something so fundamental and actually quite simple, I think.
comment:15 by , 4 weeks ago
It's far more regrettable that we have thousands of tickets, but only three people working a few hours a month for JOSM. So if you want a feature, feel free to do something about it.
My priorities have been forcefully changed and it's very unlikely I will find more time for JOSM in the future and while I keep JOSM alive there will be no real progress until some other people do something.
comment:16 by , 3 weeks ago
I'll take this one on. I think it's clearly one where the real-world utility is much less, compared to OpenGeofiction where it's much more useful.
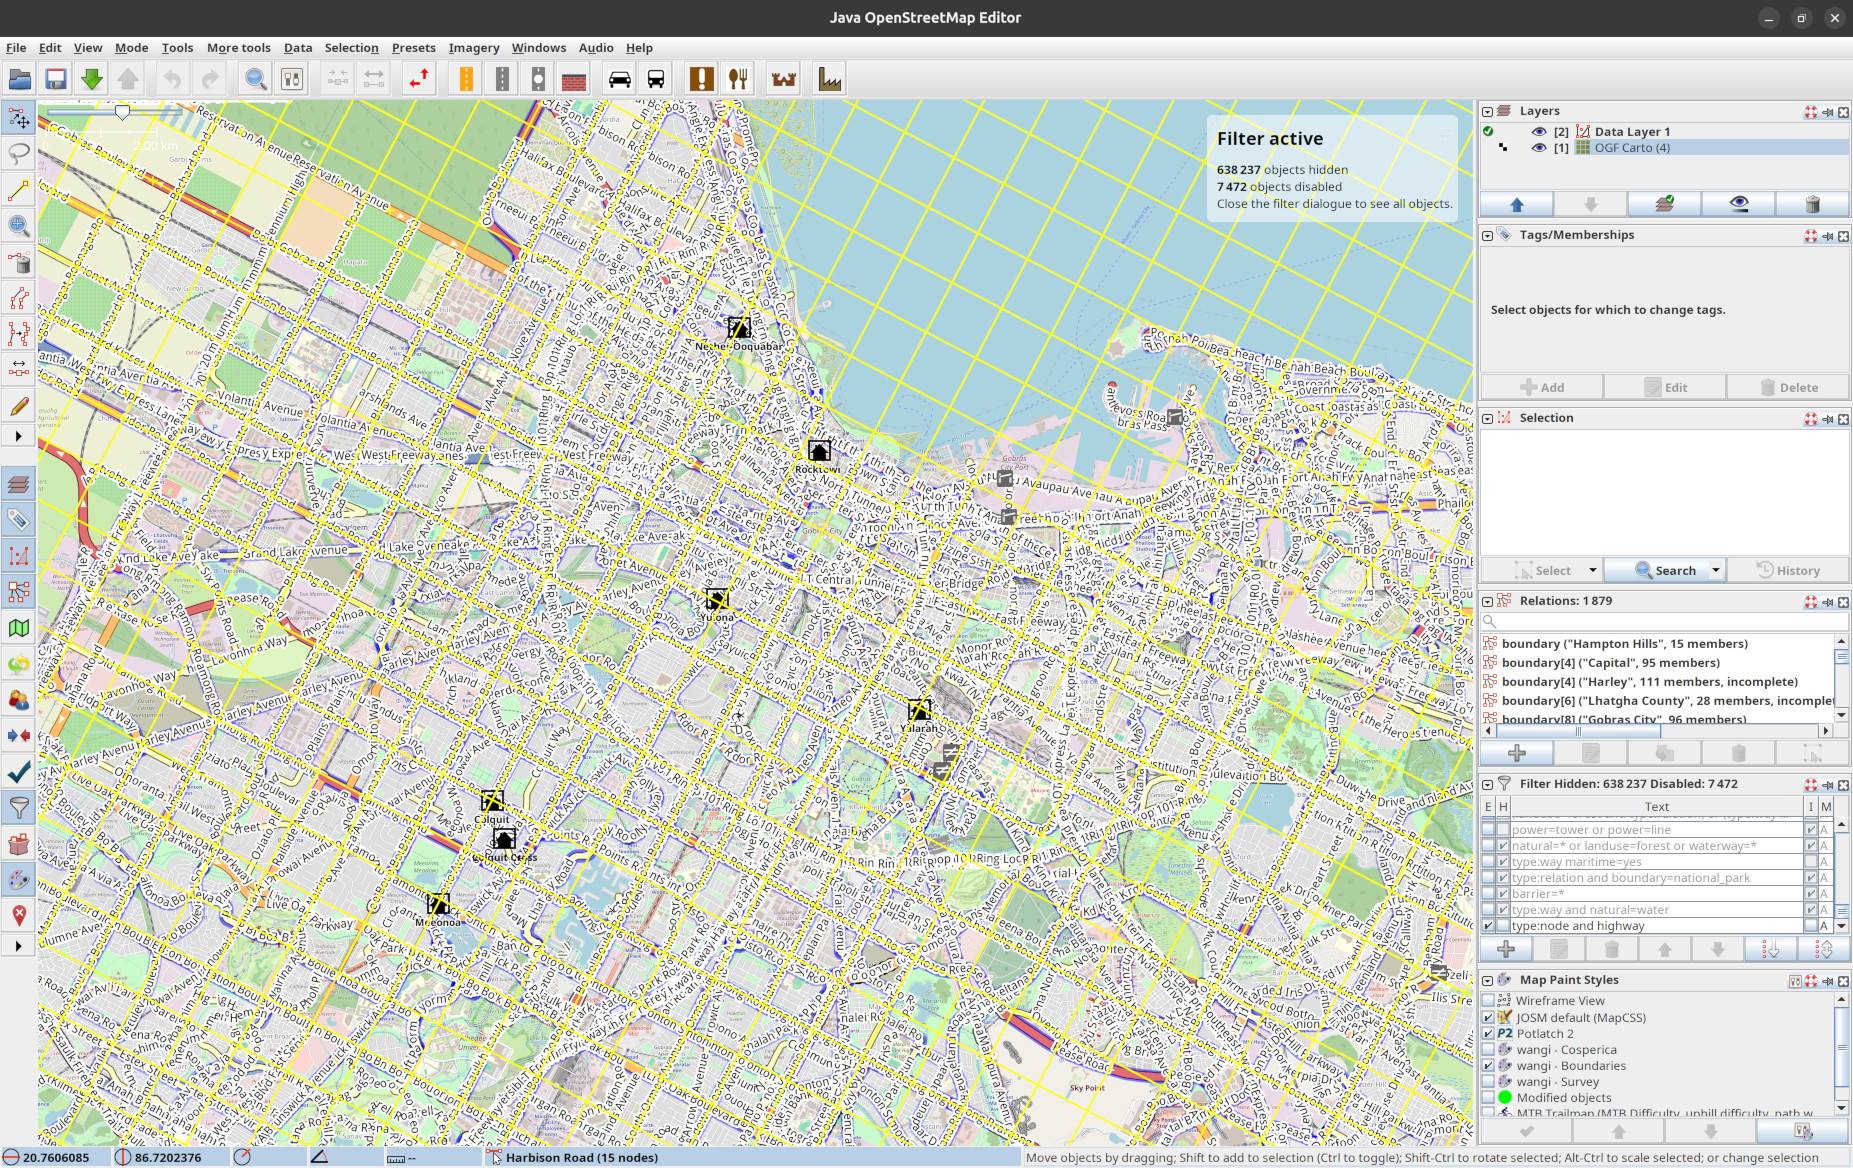
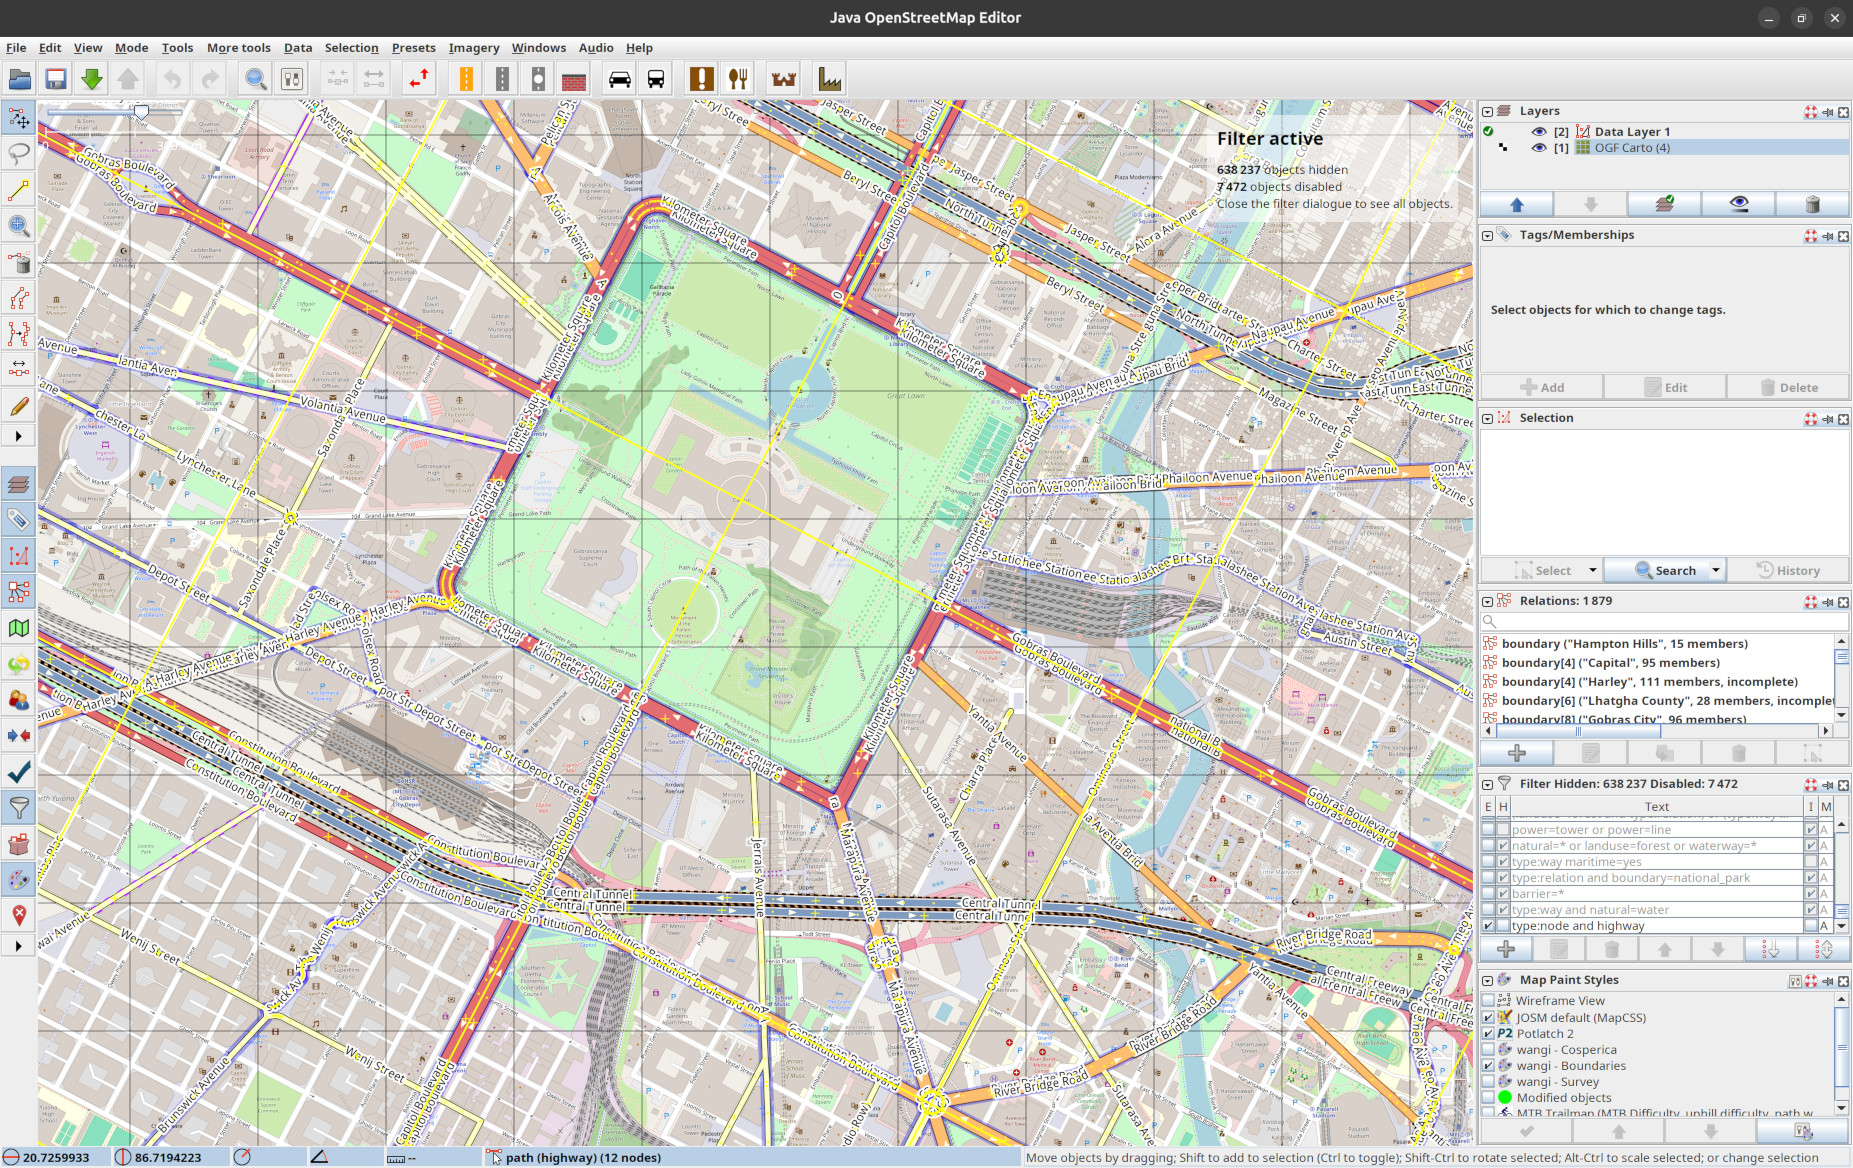
Attached is a patch implementing this ticket and #15975 (which was closed as a duplicate of this one). Example screenshots attached too.
Grid overlay
A grid is drawn over the map view above all layers. It is a visual aid only: there is no snapping to it, so drawing and editing are not affected.
Two kinds of grid:
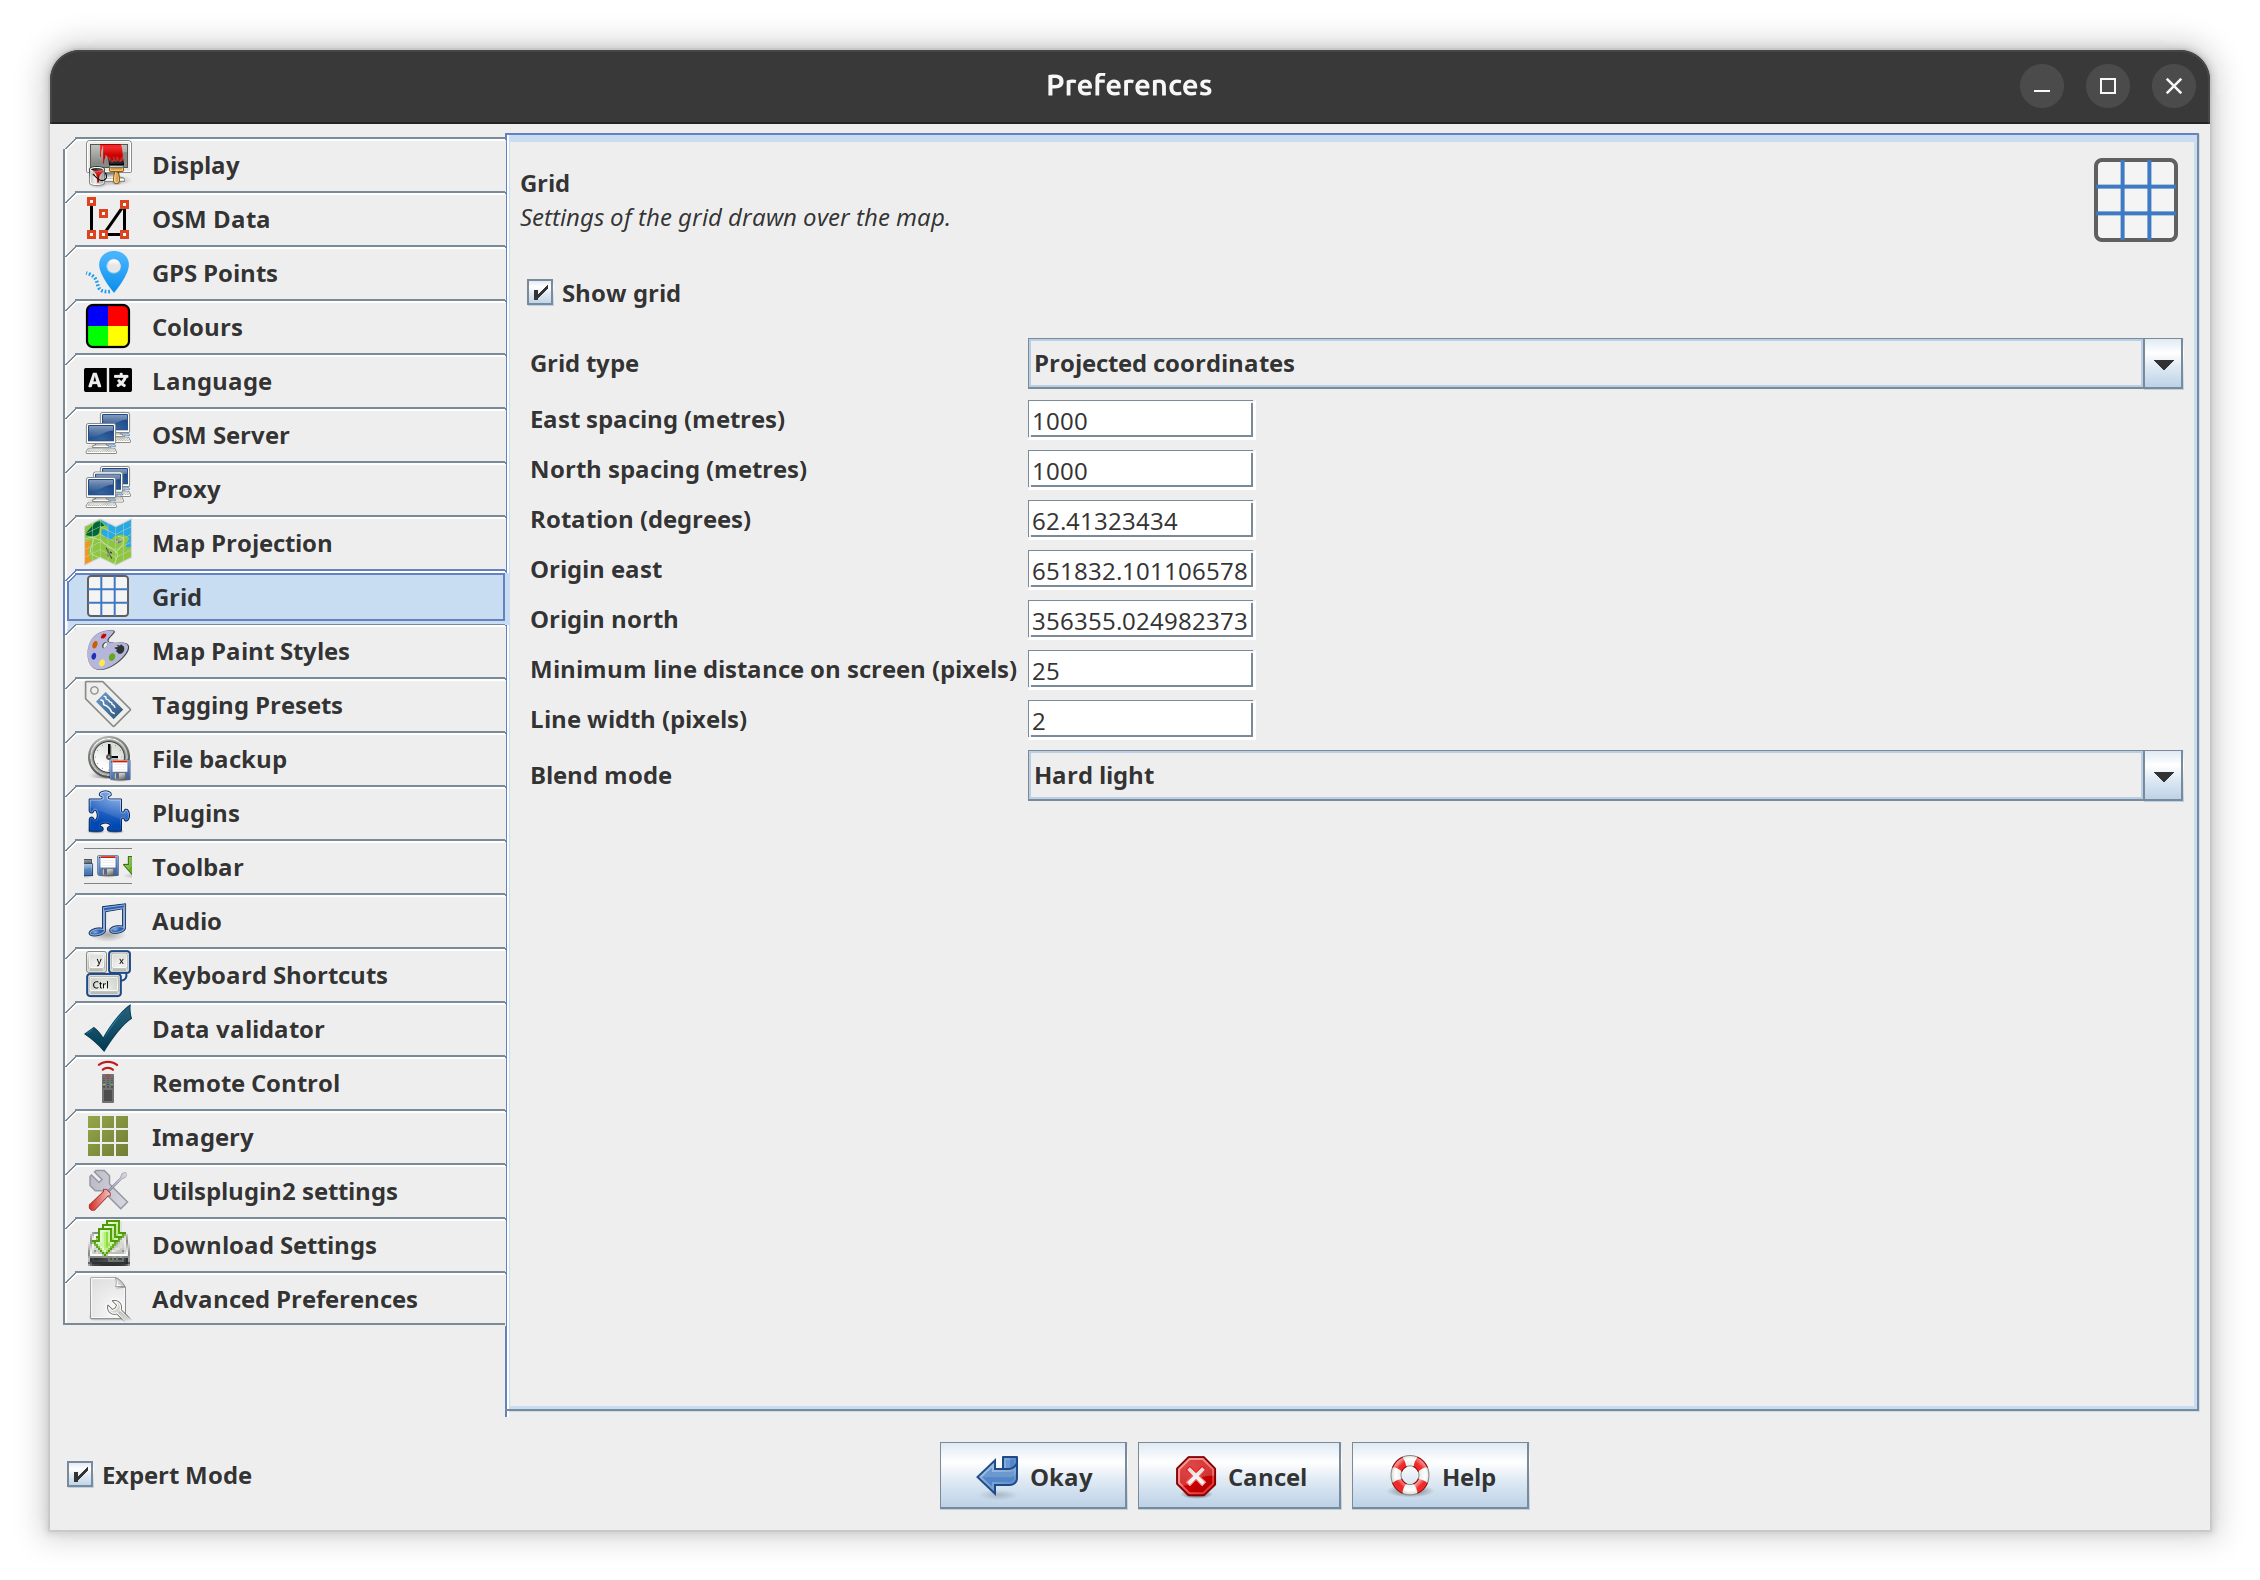
- Projected coordinates (default): lines of constant east/north coordinate of the map projection, with an east and a north spacing, a rotation and an origin. The spacing is a true distance in metres, measured at the grid origin, so that a "1000 m" grid matches what the parallel way tool and the status bar measure (in Mercator, raw projection units are metres only at the equator).
- Latitude/longitude: lines of constant latitude and longitude with a spacing in degrees. The lines are drawn as polylines, so they are correct in any projection; the antimeridian and the world bounds are handled.
When zooming out, the spacing is multiplied by 10 until the lines are at least a configurable number of pixels apart (default 25), so the grid stays readable at every zoom level while remaining aligned to the configured grid. A hard limit of 500 lines per direction protects against absurd settings.
The two line directions have their own colours ("grid east lines" / "grid north lines" in the Colors tab, default yellow), the width is configurable (default 2 px), and the lines can be blended with the map: Normal, Multiply, Burn, Hard light (default), Difference, Divide. Java2D has no blend modes, so this comes with a small custom Composite (BlendComposite); it is safe because the map view renders into a BufferedImage.
User facing changes
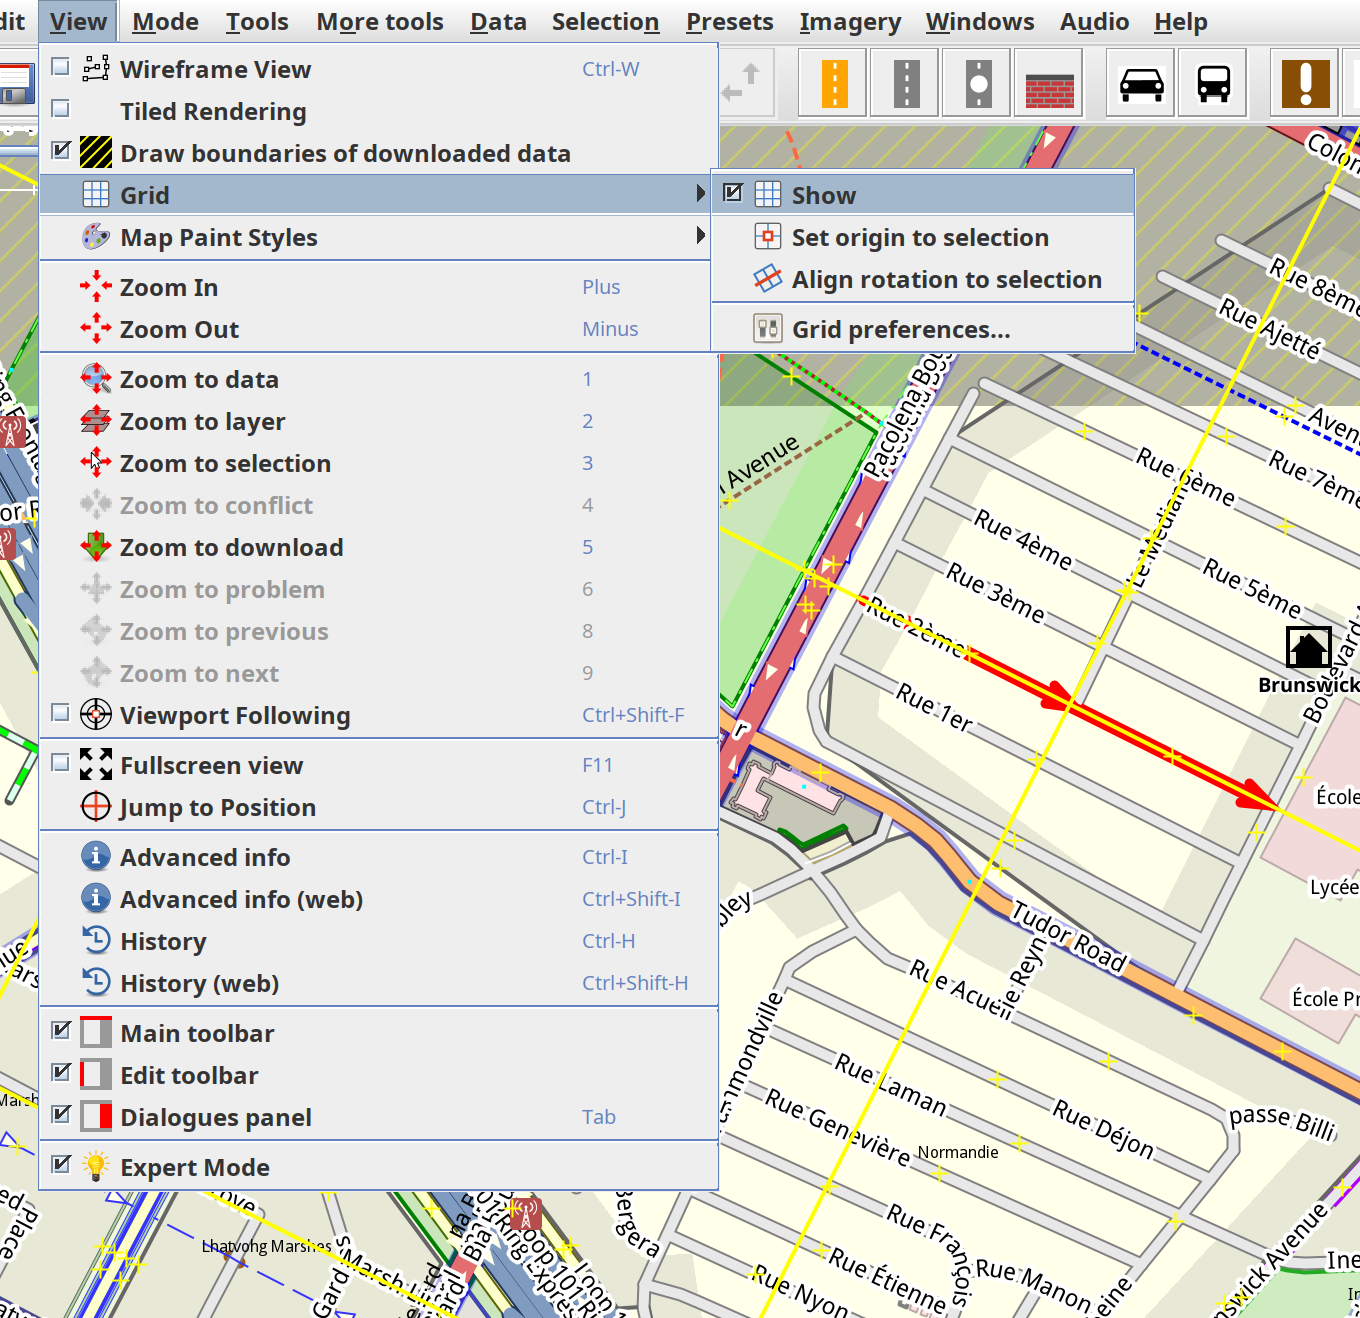
- New View > Grid submenu holds everything related to the grid: Show toggles it; Set origin to selection moves the grid so a line passes through the selected node, or through the centroid (arithmetic mean position of every node reachable from the selection) otherwise, and enables the grid; Align rotation to selection rotates the grid parallel to the selected way (first to last node) or the two selected nodes, switching to a projected grid; Grid preferences... opens the preferences dialog directly to the new Grid tab.
- New Grid preferences tab, placed below Map Projection: enable, grid type, east/north spacing, rotation, origin, minimum line distance on screen, line width, blend mode.
- Imagery layers get a Show tile borders checkbox in the layer list context menu and in the map popup menu (next to "Show tile info"). It draws a thin border around each tile (colour "imagery tile border"), is stored per layer in sessions like the other display settings, and replaces the previous debug-only red outline (which still appears with
--debug). Toggling it also writes the default for new layers, so unlike the sibling settings the choice survives a restart; loading a session sets the layer only and leaves that default alone.
Preferences: draw.grid.enabled, draw.grid.type, draw.grid.spacing-x, draw.grid.spacing-y, draw.grid.rotation, draw.grid.origin-x, draw.grid.origin-y, draw.grid.min-pixel-spacing, draw.grid.line-width, draw.grid.blend-mode; imagery.generic.default_showtileborders for the default of new imagery layers, written whenever the user toggles the tile borders.
Implementation
gui/layer/MapGridPaintable: the overlay, registered as a permanent temporary layer byMapFrame; geometry (getProjectedGridLines,getLatLonGridLines,projectionUnitsPerMetre,thinningFactor) is in static methods so it can be tested without a GUI.gui/draw/BlendComposite: the blend modes. Composing follows the "source over" rule of the W3C compositing model, so a translucent destination is handled correctly and not just the opaque map view.actions/ShowGridAction,actions/SetGridOriginAction,actions/AlignGridRotationAction(bothJosmActions wired intoMainMenu's newmapMenu).gui/preferences/display/GridPreference, registered inPreferenceTabbedPaneafterProjectionPreference.gui/layer/imagery/TileSourceDisplaySettings:showTileBorders(session propertyshow-tile-borders),gui/layer/imagery/ShowTileBordersAction, painting inAbstractTileSourceLayer.paintTileText.- Four new icons:
preferences/grid.svgfor the preferences tab, andgrid.svg/gridorigin.svg/gridrotate.svgfor the menu entries.
Unit tests
MapGridPaintableTest: axis aligned grid (line count and positions), origin offset and 45° rotation, invalid spacings and line limits, lat/lon lines (spacing, origin, clamping to the world, antimeridian), thinning factor, projection units per metre (equator, 50°, 20.6°, outside the world), and painting both grid types with a blend mode onto an image.BlendCompositeTest: exact pixel values for every mode on three image types, alpha handling, neutral colours.GridActionsTest: origin from a single selected node and from the centroid of a way's nodes and a relation's node members (both grid types), rotation reduction into [0, 90) including the four symmetric directions, selection handling (one way, two nodes, anything else disabled), live enabling/disabling as the selection changes.GridPreferenceTest,TileSourceDisplaySettingsTest(change event, session round trip, equals/hashCode).- Existing
TMSLayerTest,AbstractTileSourceLayerTest,SessionReaderTest,SessionWriterTestand the display preference tests pass unchanged; checkstyle is clean.
Known limitations: the metric spacing is exact at the origin and drifts with the Mercator scale factor away from it (about 0.3 % per 50 km north/south at 20° latitude); a latitude/longitude grid's meridians stop at the projection's usable latitude range (e.g. ±85° for Mercator) when that becomes visible, which is correct (the same limit applies to data and imagery) but can look surprising at first. The help topics /MapView#Grid and /Preferences/Grid still need wiki pages (some drafts done).
by , 3 weeks ago
| Attachment: | screenshot-01-grid.jpg added |
|---|
Grid enabled, default settings other than origin and rotation
comment:17 by , 3 weeks ago
| Owner: | changed from to |
|---|---|
| Status: | new → assigned |
comment:18 by , 3 weeks ago
| Summary: | Grid Layer for JOSM → [patch] Grid Layer for JOSM |
|---|
comment:19 by , 3 weeks ago
| Milestone: | → 26.09 |
|---|
comment:20 by , 3 weeks ago
Lat/Lon grid looks strange as soon as you zoom out and the world bounds become visible.
follow-up: 22 comment:21 by , 3 weeks ago
The "Align grid rotation to selection" as menu entry for a imagery layer is also a bit strange. Wouldn't that be an entry for a data layer in layer list (or at least both)?
comment:22 by , 3 weeks ago
Replying to stoecker:
The "Align grid rotation to selection" as menu entry for a imagery layer is also a bit strange. Wouldn't that be an entry for a data layer in layer list (or at least both)?
Yeah, I was coming from perspective of the right-click menu being heavily used for "close to the action", but that's not how it is done in JOSM. Instead I have added new "View/Grid" menu, with everything under there.
Replying to stoecker:
Lat/Lon grid looks strange as soon as you zoom out and the world bounds become visible.
They are still showing the actual tile boundaries even though. Personally, I cannot see that I'll ever turn it on.
I've updated the original comment above to cover the changes.
L/
follow-up: 25 comment:23 by , 3 weeks ago
Regarding Lat/Lon: That behaviour is eratic and will cause bug reports. As soon as world bounds are visible the drawing goes amok. Try with different window sizes and zoom levels and move the mouse around. That's strange.
See  .
.
Actually a video probably would have been helpful...
Yeah, I was coming from perspective of the right-click menu being heavily used for "close to the action", but that's not how it is done in JOSM. Instead I have added new "View/Grid" menu, with everything under there.
Right click in is fine, but you attached it to the imagery layer, whereas referencing data from the data layer. That's not logical. Actually for JOSM I'd expect the grid layer to be a layer in the layer list, so it can be turned on and off. Then you could use the popup menu of that layer.
Note - For JOSM it's fine to have multiple way to reach a function, so menu, popup, ... are fine. Different users use different ways.
comment:24 by , 3 weeks ago
Thanks, I definitely didn't see that for the tile grid zoomed out - will dig deeper later on.
Think having just the View/Grid menu is fine. I struggle thinking thinking of this as a layer, to me it's just the same sort of thing as the boundary around the downloaded data. It's a property of the map rather than an individual layer.
comment:25 by , 3 weeks ago
Replying to stoecker:
Regarding Lat/Lon: That behaviour is eratic and will cause bug reports. As soon as world bounds are visible the drawing goes amok. Try with different window sizes and zoom levels and move the mouse around. That's strange.
Managed to recreate it - it was when set to lat/lon only, and not projected coords. Fixed patch attached.





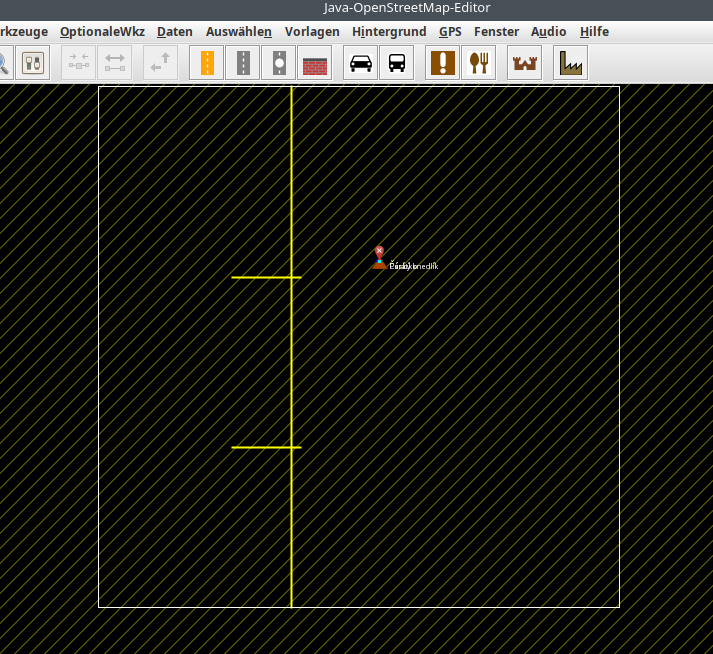
There is no such feature at the moment, but you can use a specially prepared gpx file as a background layer. here is a script.