

| Version 6 (modified by , 19 years ago) ( diff ) |
|---|
Preferences > Display Settings
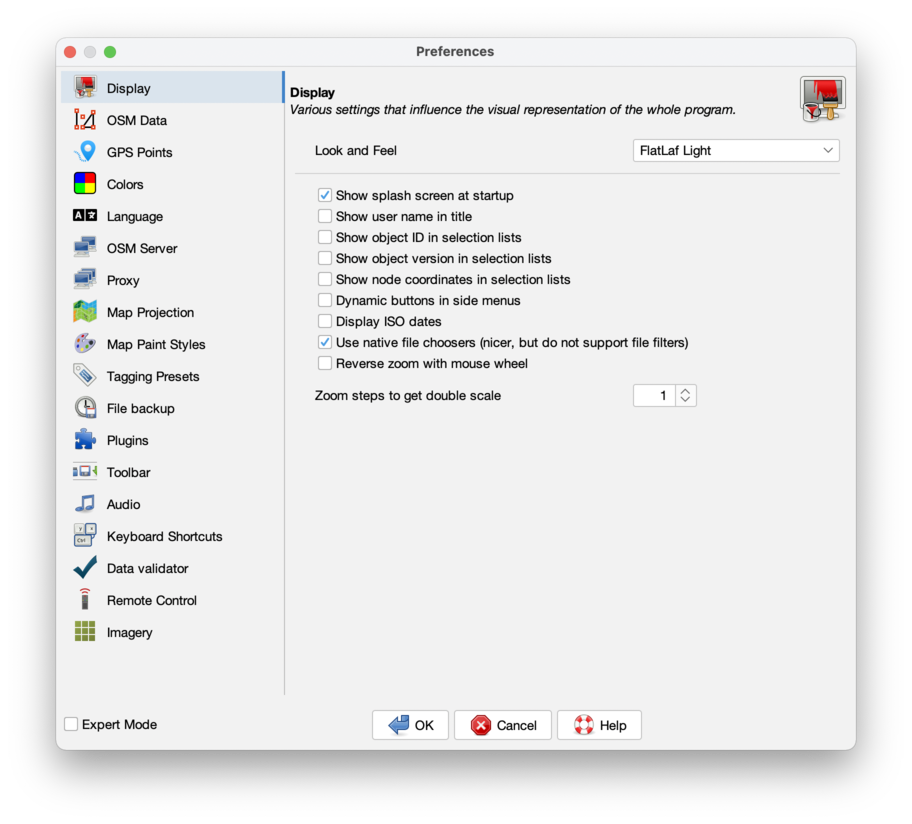
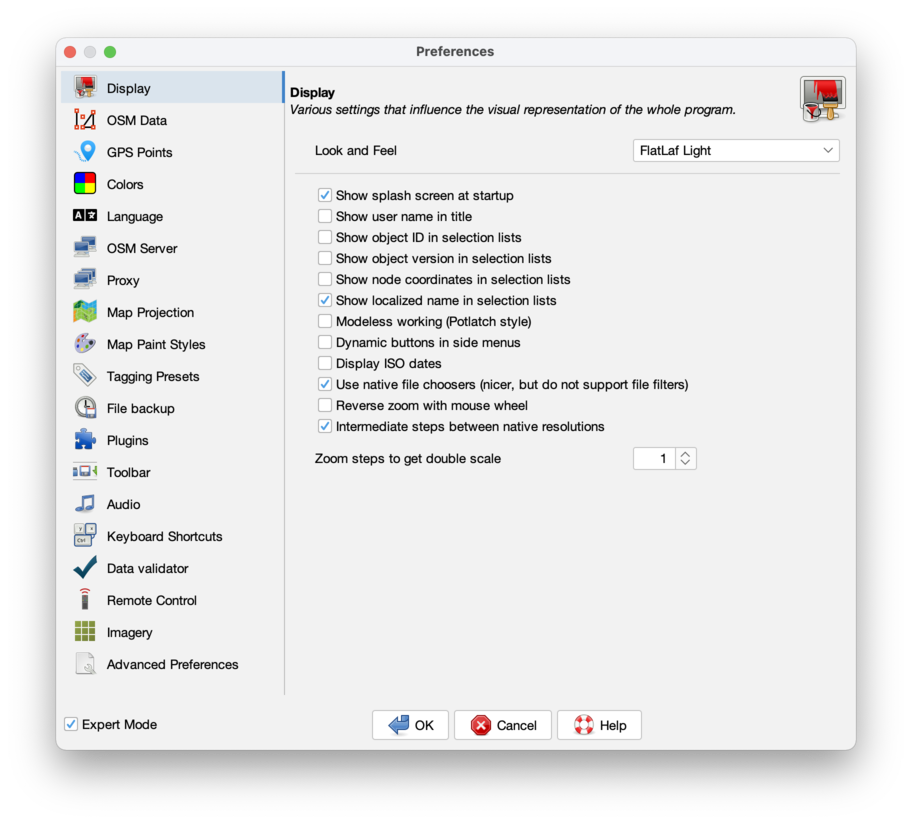
These are various settings which affect the visual look of the whole program.
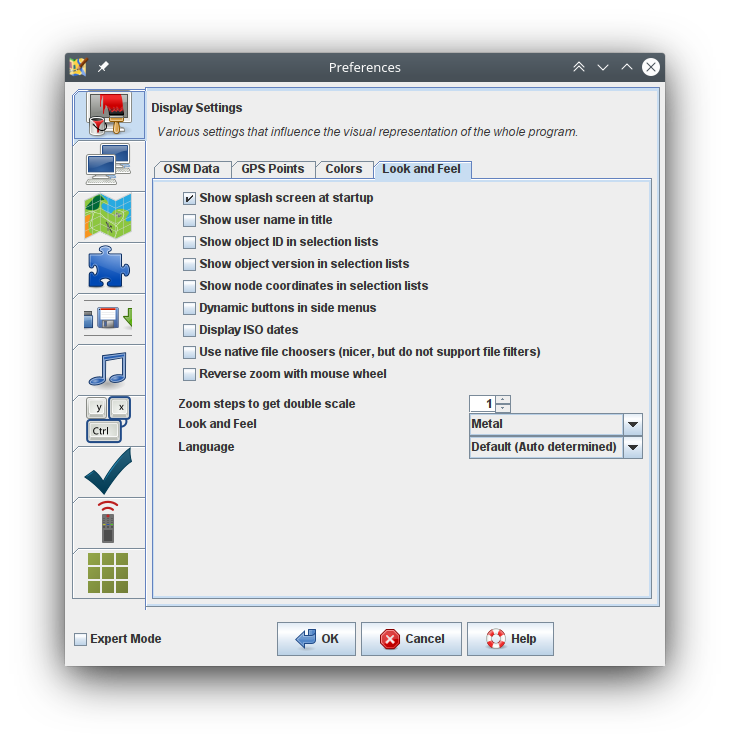
You can choose the overall theme, current options are : Metal, CDE / Motif, Windows, Windows Classic.
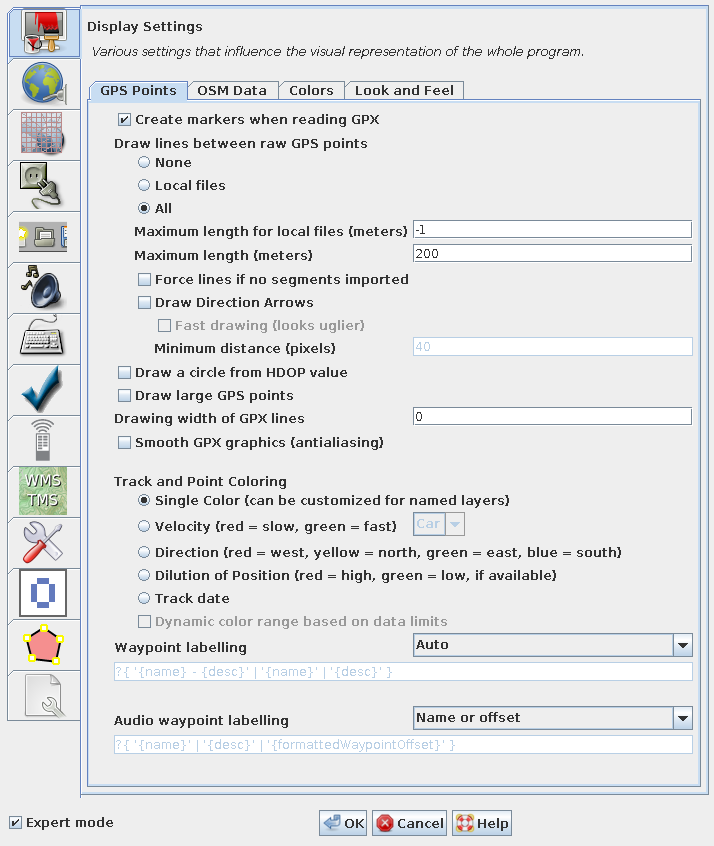
You can cause lines to be drawn between raw GPS points.
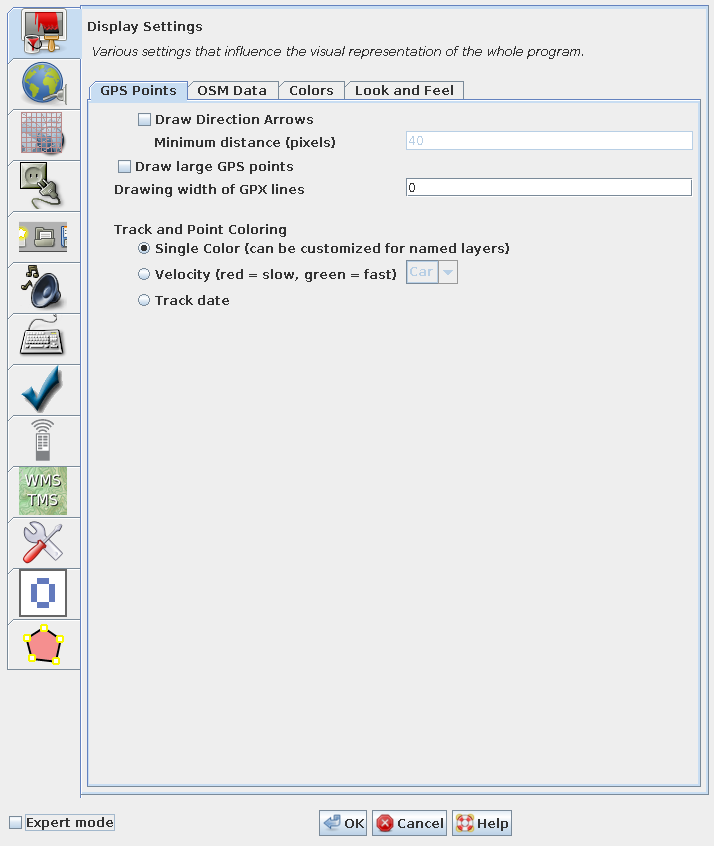
The size which GPS points are displayed in can be changed from standard to large.
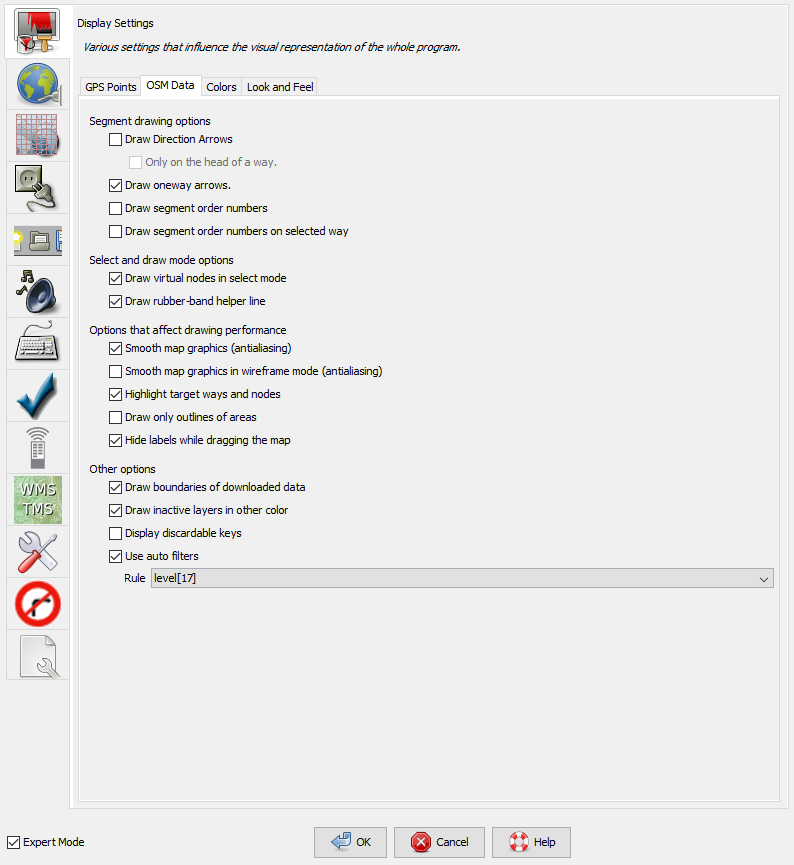
You can cause an arrow to be drawn at the end of each segment, to show the direction in which the segment was drawn.
You can opt to display segment order numbers, showing which order in the way each segment is.
You can choose to show the boundary of downloaded data. When downloading an area you get all the data within the rectangular bounding box you choose, and also, where any way within that bounding box extends outside the box it is completely downloaded. It therefore becomes difficult to precisely know which areas you have downloaded full data for. If you check the "Draw boundaries of downloaded data" box, a yellow rectangle is drawn around all the areas for which full data has been downloaded. Caution should be exercised when adding new data to areas outside these rectangles as it may duplicate already existing data.
You can choose to display inactive layers in a different colour.
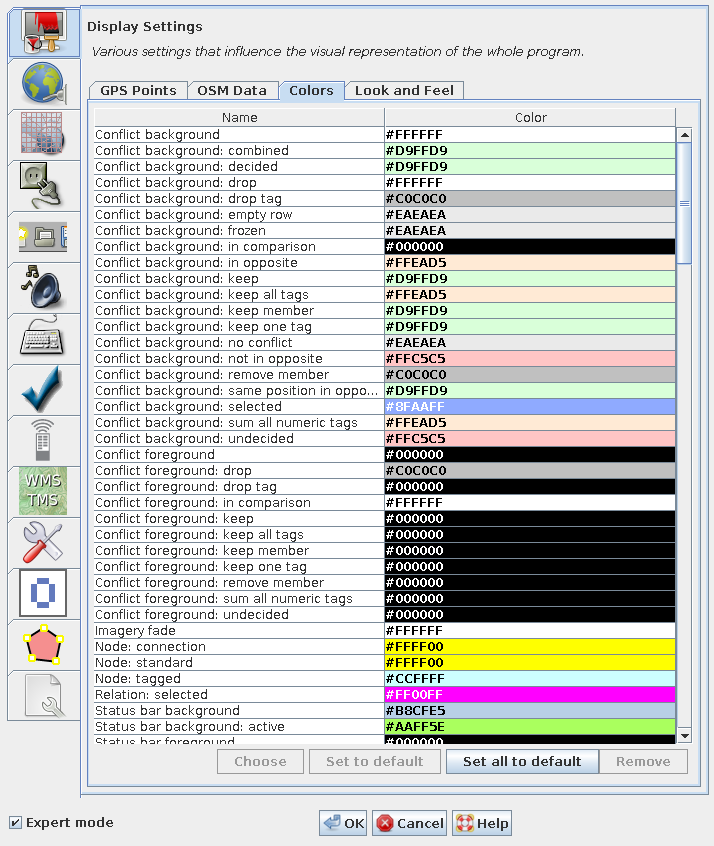
You can change the colour scheme for the display of nodes, ways, background, etc.
Back to Main Help
Attachments (8)
- gps-points.png (77.5 KB ) - added by 10 years ago.
- colors.png (88.2 KB ) - added by 10 years ago.
- gps-points-no-expert.png (62.3 KB ) - added by 10 years ago.
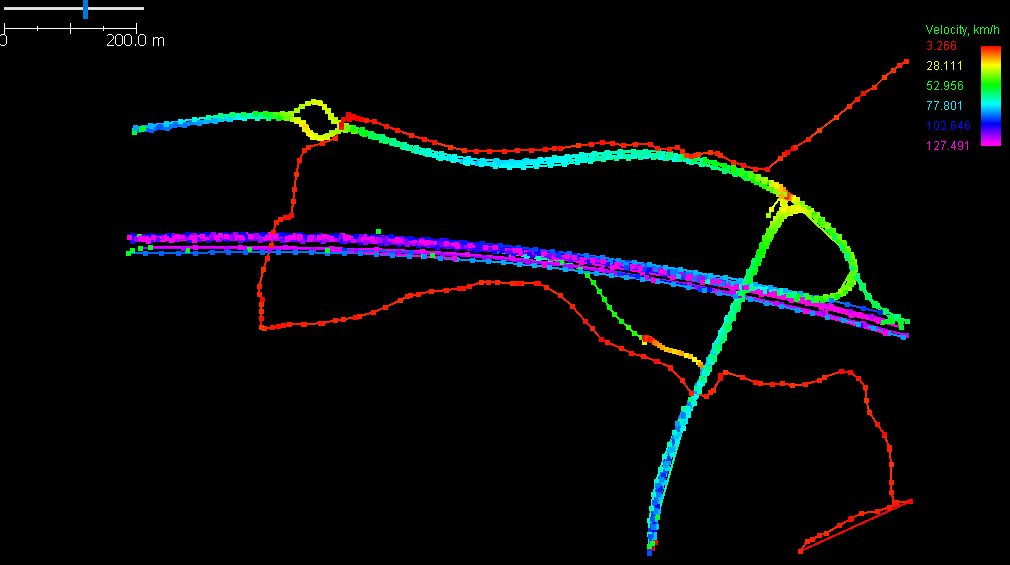
- velocity.png (17.7 KB ) - added by 9 years ago.
- osm-data.png (66.0 KB ) - added by 8 years ago.
-
look-and-feel.png
(90.5 KB
) - added by 6 years ago.
Tab "Look and Feel" of preferences "Display Settings"
-
PreferencesDisplay.png
(168.5 KB
) - added by 5 years ago.
new screenshot
-
PreferencesDisplayExpert.png
(155.3 KB
) - added by 5 years ago.
new expert mode screenshot
Download all attachments as: .zip