

| Version 26 (modified by , 8 years ago) ( diff ) |
|---|
This page is incomplete and needs some rework.
Languages:
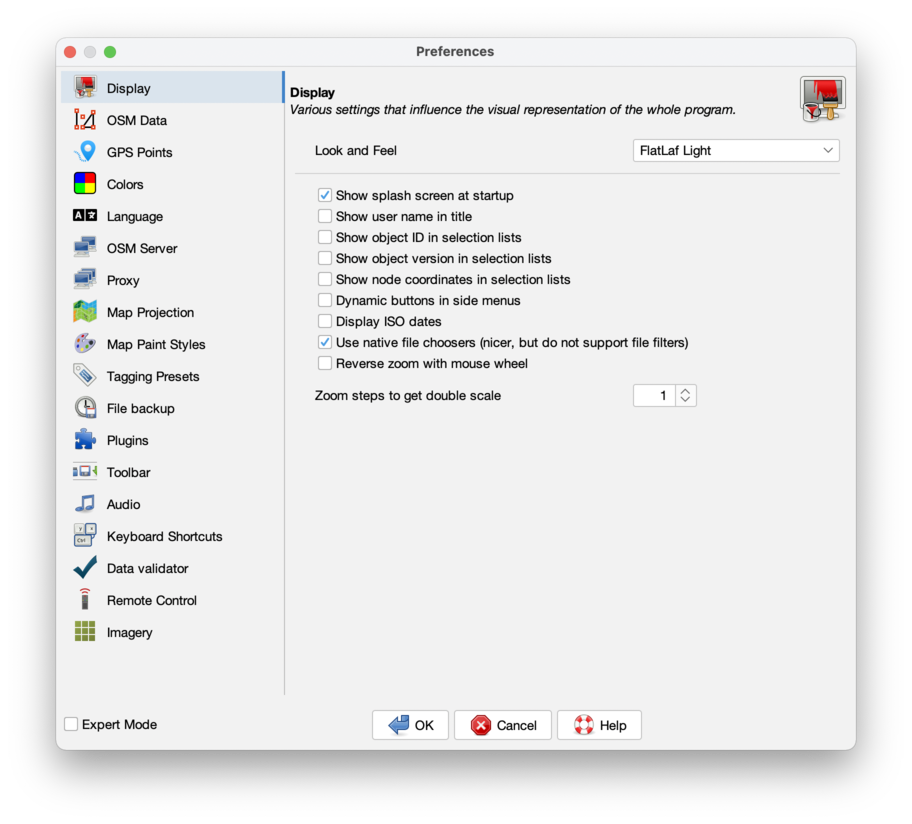
Preferences > Display Settings

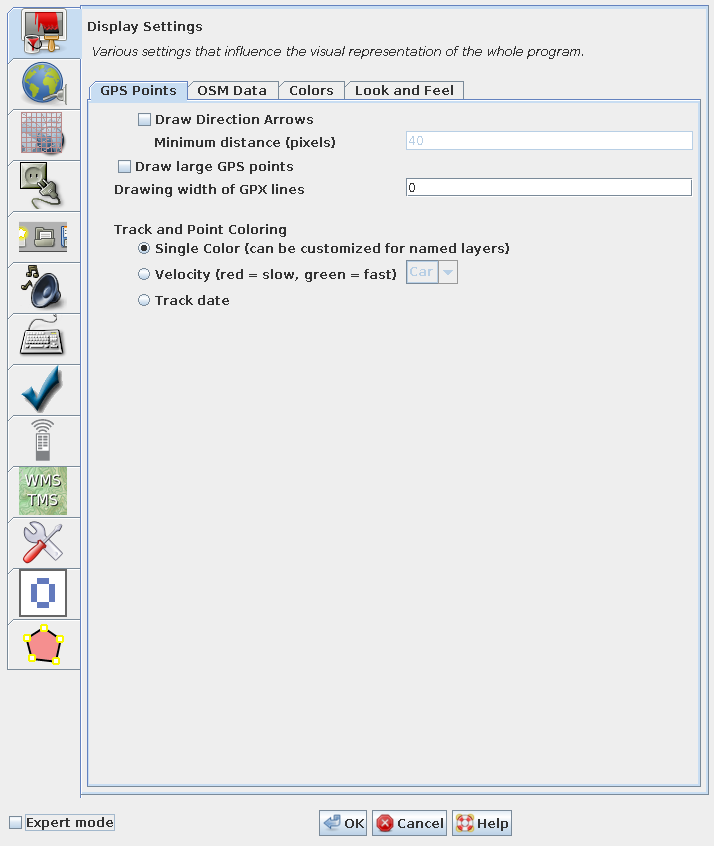
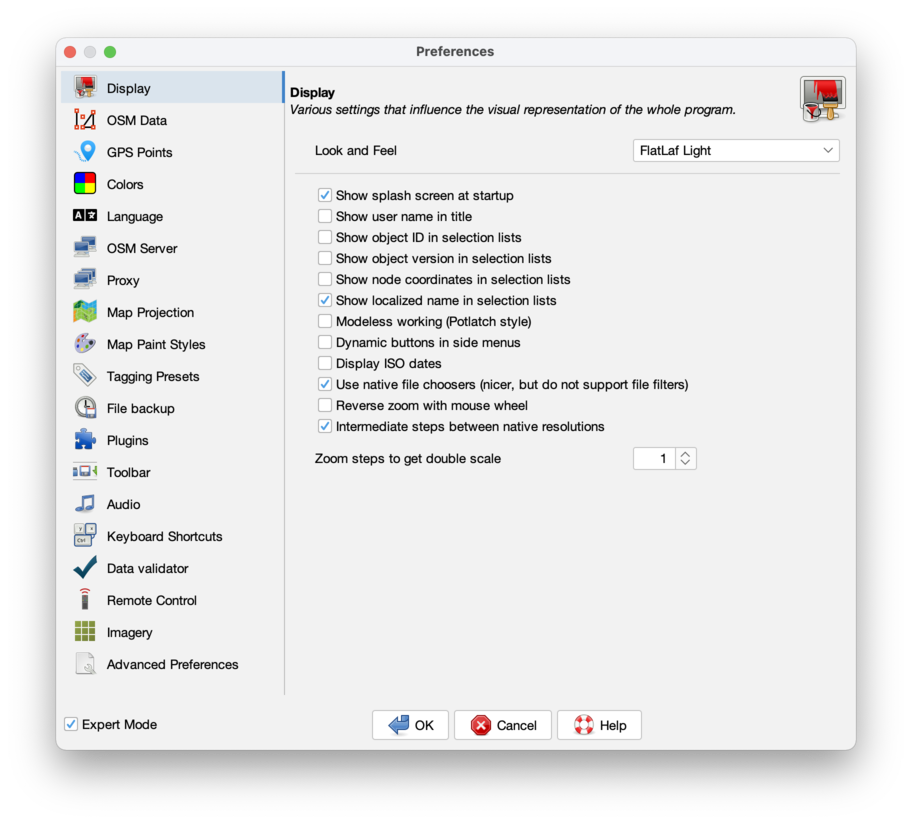
Various settings that influence the visual representation of the whole program. Display settings are grouped into several tabs 'GPS Points', 'OSM Data', 'Colours', 'Look and feel'. Some settings are only displayed in expert mode.
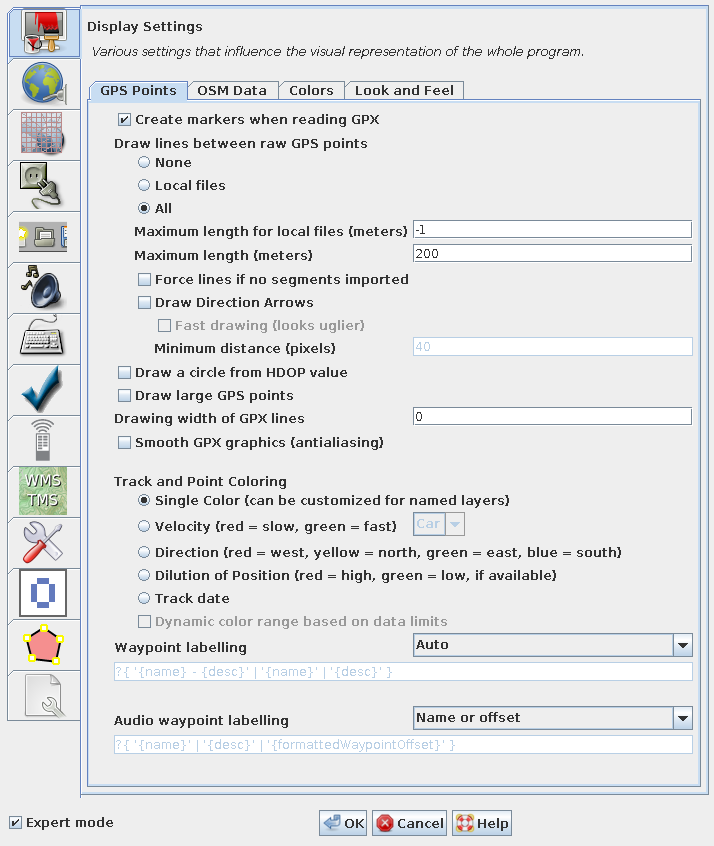
GPS Points
Settings to do with the display of GPS Points. These settings control the display of track points if you use JOSM with GPS traces loaded in from a local file, or everybody's trackpoints downloaded from the OpenStreetMap server.
You can cause lines to be drawn between raw GPS points.
The size which GPS points are displayed in can be changed from standard to large.


Track and point coloring
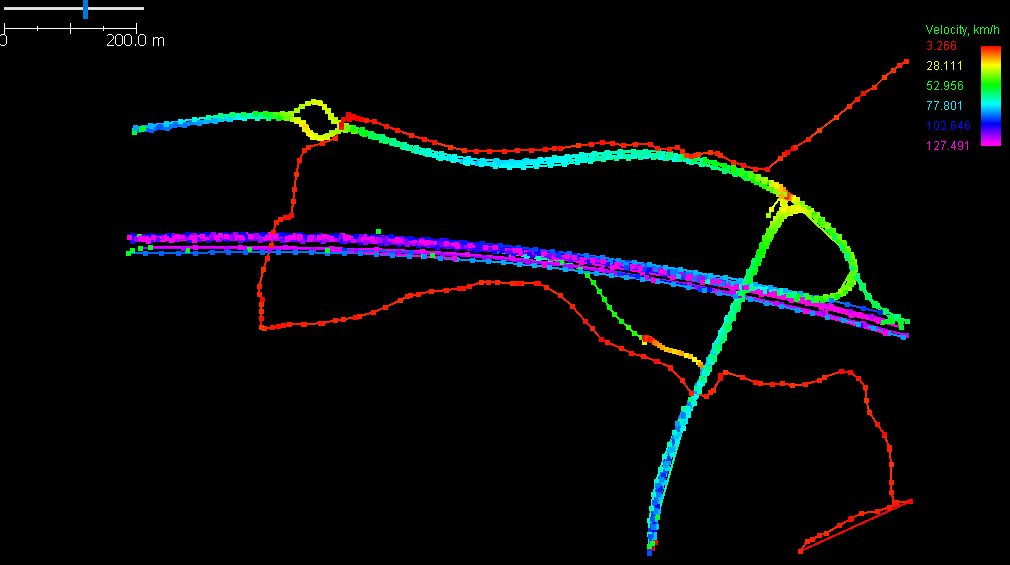
There are different ways to colorize gps-tracks.
When choosing one of Velocity, Direction or Dilution of Position, a legend is displayed in the top right corner of the map view if the gpx-layer is the current active layer. Example:

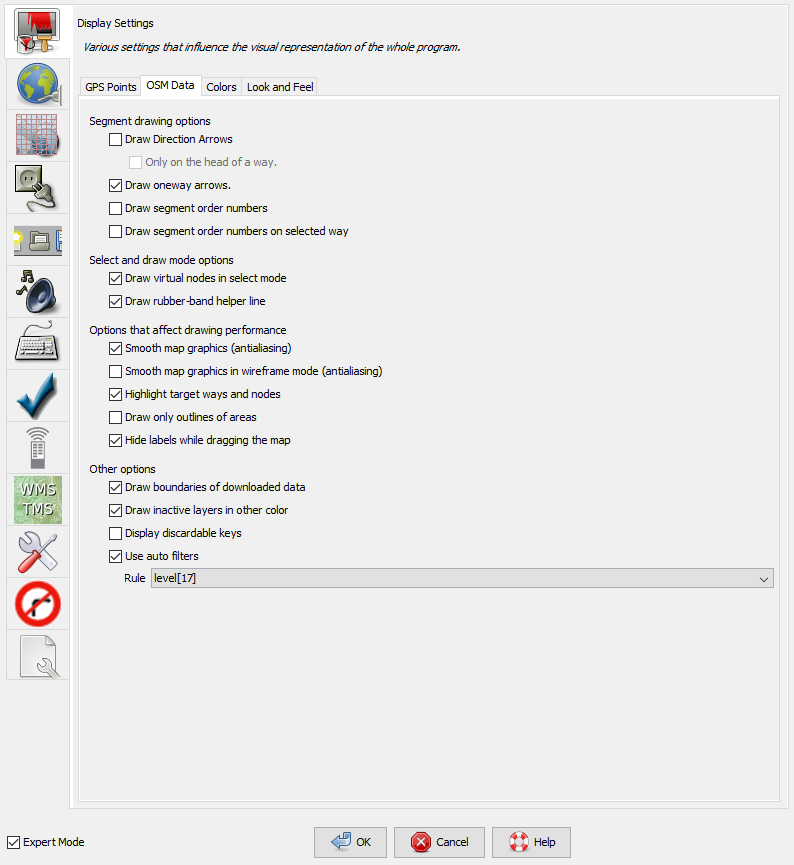
OSM Data
Settings to do with map data layers shown in JOSM (ways/nodes etc)
You can cause an arrow to be drawn at the end of each segment, to show the direction in which the segment was drawn. You can also choose to have that arrow drawn only at the end of the way instead. Also, for some ways that have direction dependent tags (like oneway) oneway arrows can be shown.
You can choose to show the boundary of downloaded data. When downloading an area you get and see all the data within the rectangular bounding box you chose. This includes complete ways extending outside that box. It therefore becomes difficult to distinguish which areas contain full or partial data. If you check the "Draw boundaries of downloaded data" box, yellow hatching is drawn over all the areas into which data has not been fully downloaded. You should avoid adding or editing data in areas of yellow hatching as it may duplicate already existing data or conflict with data you don't see.
You can choose to display inactive layers in a different colour.
In addition to these, the option to switch from "wireframe" to "paint" view can be found on the 'View' menu
Auto filters can be enabled here and the key to be used for the autofilter can be choosen.

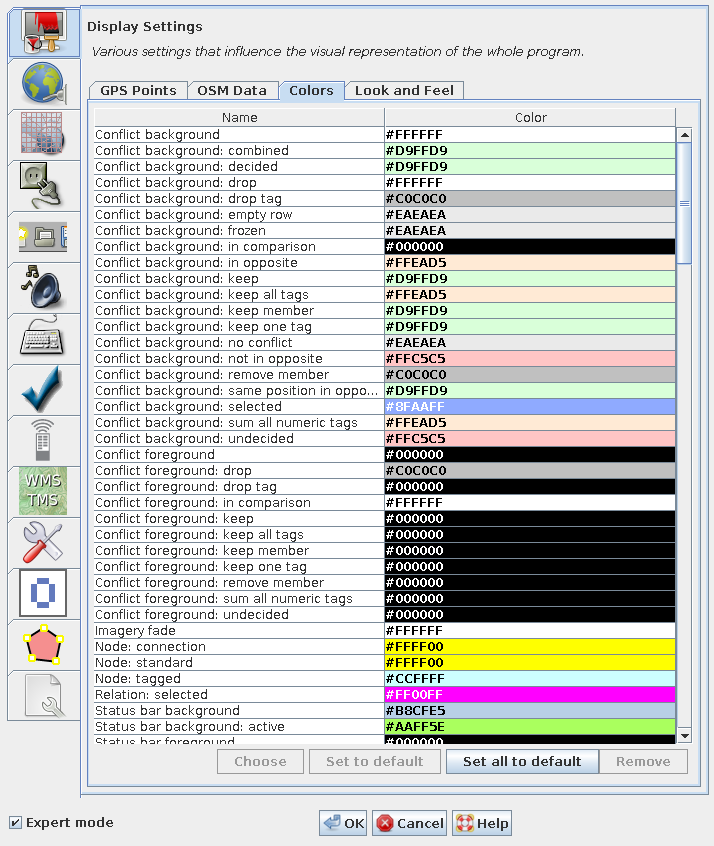
Colors
Color choices. These largely relate to display of OSM data layers too. You can change the color scheme for the display of nodes, ways, background, etc. "Paint style" options all relate to the non-wireframe view ('View' menu option)

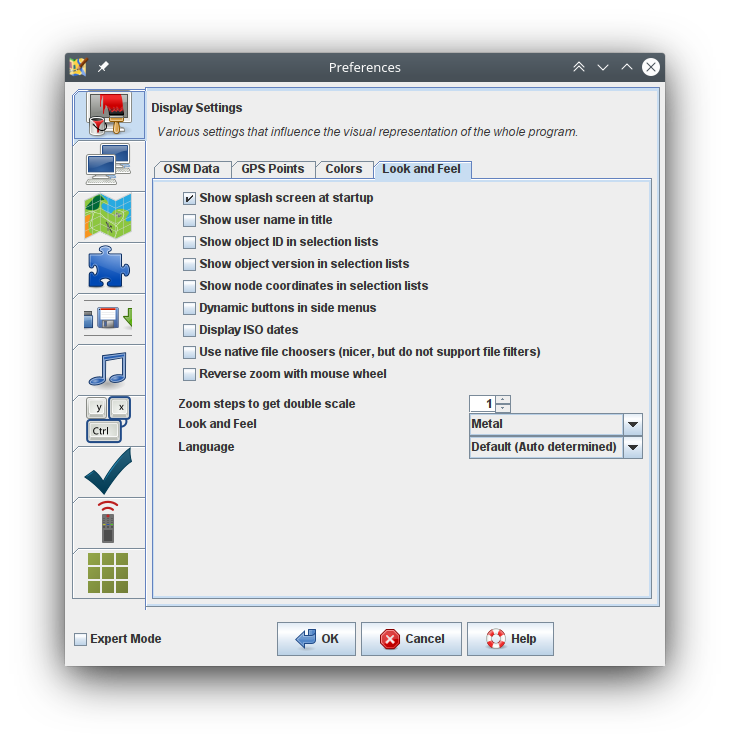
Look and Feel
Some overall look and feel options
- You can change the language of the JOSM interface here.
- You can choose the overall theme, current options are : Metal, CDE / Motif, Windows, Windows Classic.
- The [Modeless Working] option modifies the click behavior when editing. It transits between modes in a more automatic way, similar to the online flash editor Potlatch.

Back to Preferences
Back to Main Help
Attachments (8)
- gps-points.png (77.5 KB ) - added by 10 years ago.
- colors.png (88.2 KB ) - added by 10 years ago.
- gps-points-no-expert.png (62.3 KB ) - added by 10 years ago.
- velocity.png (17.7 KB ) - added by 8 years ago.
- osm-data.png (66.0 KB ) - added by 7 years ago.
-
look-and-feel.png
(90.5 KB
) - added by 5 years ago.
Tab "Look and Feel" of preferences "Display Settings"
-
PreferencesDisplay.png
(168.5 KB
) - added by 5 years ago.
new screenshot
-
PreferencesDisplayExpert.png
(155.3 KB
) - added by 5 years ago.
new expert mode screenshot
Download all attachments as: .zip